Installing the CREW software package
From CrewWiki
(→Examples of SEVIRI retrieval inter-comparison (CREW software only)) |
|||
| Line 104: | Line 104: | ||
== Examples of SEVIRI retrieval inter-comparison (CREW software only) == | == Examples of SEVIRI retrieval inter-comparison (CREW software only) == | ||
| + | ==Display a cloud property of one algorithm on the MSG disk== | ||
| + | <code> | ||
| + | o=obj_new('cws_stats') <br> | ||
| + | o->set_product,'cth'<br> | ||
| + | o->set_group,'CMS'<br> | ||
| + | o->set_date,2008,6,13,12,15<br> | ||
| + | o->make_image, /single<br> | ||
| + | obj_destroy, o<br> | ||
| + | </code><br> | ||
| + | [[File:single_image.png|200px|CMS cloud top height]]<br> | ||
| + | <br> | ||
| + | |||
| + | ==Difference of one data set to another (one picture per algorithm pair)== | ||
| + | <code> | ||
| + | o=obj_new('cws_stats') <br> | ||
| + | o->set_product,'ctt'<br> | ||
| + | o->set_date,2008,6,13,12,00<br> | ||
| + | o->diff_maps, group='AWG'<br> | ||
| + | obj_destroy, o<br> | ||
| + | </code><br> | ||
| + | [[File:ctp_difference.jpg|200px|cloud top temperature difference]] | ||
| + | <br> | ||
| + | |||
| + | ==Display a cloud property of all algorithms on the MSG disk== | ||
| + | <code> | ||
| + | o=obj_new('cws_stats') <br> | ||
| + | o->set_product,'ctp'<br> | ||
| + | o->set_date,2008,6,13,12,00<br> | ||
| + | o->make_image, /no_track<br> | ||
| + | obj_destroy, o<br> | ||
| + | </code><br> | ||
| + | [[File:group_image2.jpg|200px|overview cloud top pressure]] | ||
| + | <br> | ||
| + | |||
| + | ==Calculate multi algorithm ensemble average== | ||
| + | Note, first you have to calculate the multi ensemble average with <code>o->algorithm_average(/calc, /save, mask='com')</code>. As the default resolution is a reduced resolution, you have to specify explecitely the <code>scale=1</code>, when you create the <code>cws_stats</code> object. If the average file is created, you can handle the average like a group by setting the group to 'AVG' and make plots like in the other examples (and of cause you can use the default reduced resolution again). By setting the group to 'NOBS' you can make plots of the number of algorithm observation.<br> | ||
| + | <code> | ||
| + | o=obj_new('cws_stats', scale=1) <br> | ||
| + | o->set_product,'ctt'<br> | ||
| + | o->set_date,2008,6,13,12,00<br> | ||
| + | avg = o->algorithm_average(/calc, /save, mask='com')<br> | ||
| + | o->set_group,'AVG'<br> | ||
| + | o->make_image, /single<br> | ||
| + | o->set_group,'NOBS'<br> | ||
| + | o->make_image, /single<br> | ||
| + | obj_destroy, o<br> | ||
| + | </code><br> | ||
| + | [[File:multi_algorithm_average.jpg|200px|multi algorithm average]] [[File:number_of_observations.jpg|200px|number of observations]] | ||
| + | <br> | ||
| + | |||
| + | ==Calculate multi algorithm ensemble standard deviation== | ||
| + | Note, first you have to calculate (and save) the multi algorithm ensemble average like in the example before. Then you have to calculate the multi algorithm ensemble standard deviation. Like in the example before, you have to specify explecitely the <code>scale=1</code>, when you create the <code>cws_stats</code> object. If the standard deviation file is created, you can handle the absolute and relative standard deviations like a group by setting the group to 'STD_ABS' and 'STD_REL' respectively, and make plots like in the other examples (and of cause you can use the default reduced resolution again).<br> | ||
| + | <code> | ||
| + | o=obj_new('cws_stats', scale=1) <br> | ||
| + | o->set_product,'ctt'<br> | ||
| + | o->set_date,2008,6,13,12,00<br> | ||
| + | std_abs = o->algorithm_stddev (/calc, /save, mask='com')<br> | ||
| + | o->set_group,'STD_ABS'<br> | ||
| + | o->make_image, /single, min=0, max=20<br> | ||
| + | std_rel = o->algorithm_stddev (/calc, /save, mask='com', /relative)<br> | ||
| + | o->set_group,'STD_REL'<br> | ||
| + | o->make_image, /single<br> | ||
| + | obj_destroy, o<br> | ||
| + | </code><br> | ||
| + | [[File:multi_algorithm_abs_stddev.jpg|200px|absolute multi algorithm standard deviation]] [[File:multi_algorithm_rel_stddev.jpg|200px|relative multi algorithm standard deviation]] | ||
| + | <br> | ||
| + | |||
| + | ==1d histogram== | ||
| + | <code> | ||
| + | o=obj_new('cws_stats') <br> | ||
| + | o->set_product,'ctp'<br> | ||
| + | o->set_date,2008,6,13,12,00<br> | ||
| + | o->hist1d<br> | ||
| + | obj_destroy, o<br> | ||
| + | </code><br> | ||
| + | [[File:histogram.jpg|200px|cloud top pressure histogram]]<br> | ||
| + | <br> | ||
| + | |||
| + | ==dependency on latitude== | ||
| + | <code> | ||
| + | o=obj_new('cws_stats') <br> | ||
| + | o->set_product,'cth'<br> | ||
| + | o->set_date,2008,6,13,12,00<br> | ||
| + | o->dep<br> | ||
| + | obj_destroy, o<br> | ||
| + | </code><br> | ||
| + | [[File:ctt_latitude.jpg|200px|latitudinal mean of cloud top temperature]]<br> | ||
| + | <br> | ||
| + | |||
| + | ==dependency on viewing zenith angle== | ||
| + | <code> | ||
| + | o=obj_new('cws_stats') <br> | ||
| + | o->set_product,'ctp'<br> | ||
| + | o->set_date,2008,6,13,12,00<br> | ||
| + | o->dep, /vza<br> | ||
| + | obj_destroy, o<br> | ||
| + | </code><br> | ||
| + | [[File:viewing_zenith_angle.jpg|200px|cloud top pressure per viewing zenith angle]]<br> | ||
| + | <br> | ||
| + | |||
| + | ==Simple statistics as a table== | ||
| + | <code> | ||
| + | o=obj_new('cws_stats') <br> | ||
| + | o->set_product,'ctp'<br> | ||
| + | o->set_date,2008,6,13,12,00<br> | ||
| + | o->make_tables<br> | ||
| + | obj_destroy, o<br> | ||
| + | </code><br> | ||
| + | [[File:ctp_table.jpg|200px|cloud top pressure statistics]]<br> | ||
| + | <br> | ||
| + | |||
| + | ==Two algorithm scatter plot== | ||
| + | <code> | ||
| + | o=obj_new('cws_stats')<br> | ||
| + | o->set_product,'ctt'<br> | ||
| + | o->set_date,2008,6,13,12,00<br> | ||
| + | o->make_corSingle<br> | ||
| + | obj_destroy, o<br> | ||
| + | </code><br> | ||
| + | [[File:corSingle.jpg|200px|cloud top temperature scatter plots]] | ||
| + | <br> | ||
| + | |||
| + | ==Thumbnails of all scatter plots== | ||
| + | <code> | ||
| + | o=obj_new('cws_stats') <br> | ||
| + | o->set_product,'ctt'<br> | ||
| + | o->set_date,2008,6,13,12,00<br> | ||
| + | o->make_corThumb<br> | ||
| + | obj_destroy, o<br> | ||
| + | </code><br> | ||
| + | [[File:corThumb.jpg|200px|overview cloud top temperature correlation plots]] | ||
| + | <br> | ||
| + | |||
| + | ==Make ISCCP like plots== | ||
| + | <code> | ||
| + | o=obj_new('cws_stats') <br> | ||
| + | o->cod_ctp<br> | ||
| + | obj_destroy, o<br> | ||
| + | </code><br> | ||
| + | [[File:isccp.jpg|200px|ISCCP like CTP COD histogram]] | ||
| + | <br> | ||
== Examples of SEVIRI retrieval validation against ATRAIN (CREW and AVACS software) == | == Examples of SEVIRI retrieval validation against ATRAIN (CREW and AVACS software) == | ||
Revision as of 09:25, 26 February 2014
Within the CREW project a software package was developed for the inter-comparison and validation against CALIOP, CPR and AMSR-E data. The software package currently has a beta version status. We would like to invite every user to give us feedback to improve the software package. The functionality of the CREW software package includes:
- displaying cloud properties on the SEVIRI disk or other user specified areas
- multi algorithms ensemble means and standard devations
- histograms
- latitudinal means
- plotting cloud property against viewing zenith angle
- scatter plots (SEVIRI algorithm A against SEVIRI algorithm B)
- ISCCP type plots (frequency distribution in dependence of cloud optical thickness and cloud top pressure)
- scatter plots (SEVIRI algorithm against CALIOP/CPR/AMSR-E)
- cross section plots along the ATRAIN tracks
- Taylor diagrams
Several steps have to be completed before you can use the CREW software package if you like to intercompare SEVIRI retrievals:
Installation procedure for SEVIRI dataset inter-comparison
Registration at ICARE
Please send us an email to register at the ICARE service.
Download the CREW software
Go to a folder, where you would like to install the CREW software (4.4MB).
Download an unpack the CREW software package crewsoftware.tar.gz
unpack the software archive (for Linux use tar -xzf crewsoftware.tar.gz, for windows use some kind of zip software)
Download the CREW SEVIRI database in common format
Go to a folder, where you have place to store a large SEVIRI dataset (8.7GB).
Download an unpack the CREW software package DATA_CREW3_common.tar.gz
unpack the software archive (for Linux use tar -xzf DATA_CREW3_common.tar.gz, for windows use some kind of zip software)
Adjust some files
A) Add a idl start_up file to your <homedir>/.bashrc
# set IDL startup file

export IDL_STARTUP=${HOME}/.idl/idl_startup.pro
B) Modify (or create) your idl_startup file ${HOME}/.idl/idl_startup.pro
!PATH=!PATH+":<path to crewsoftware>/cws3/trunk/tools/"

!PATH=!PATH+":<path to crewsoftware>/cws3/trunk/tools/subtools/"

!PATH=!PATH+":<path to crewsoftware>/cws3/trunk/tools/subtools/msg/"
where <path to crewsoftware> is the absolute path to the directory where you save the CREW software.
C) Add some more lines in your idl_startup file
 DEFSYSV, '!PROJECTS', { $

cws_path:  '<path to crewsoftware>/cws3/trunk/', $

cws_archive: '<path to SEVIRI database in common format>/'}
Create your first image
Start idl from your command line and type following commands:
o=obj_new('cws_read')

o->set_date,2008,6,13,12,00

o->set_product,'ctt'

o->set_group,'AWG'

array = o->get_data()

view2d,array,/cool,/colo,no_data_idx=where(array le 0)

obj_destroy, o
or try another interactive example or some more advanced example
Installation procedure for comparing SEVIRI with ATRAIN measurements
Now you completed everything for inter-comparison of SEVIRI cloud retrievals from the common database. The CREW software in combination with the AVACS software has the functionality to compare the SEVIRI cloud retrievals with data sets of the ATRAIN satellite constellation. Therefore, you have to install also the AVACS software.
Get the AVACS software
Contact Phil Watts (EUMETSAT) for access to the AVACS software.
Download the dataset for AVACS
Go to a folder, where you have place to store a large AVACS dataset for CREW, e.g. AVACS_data.
We splitted the data into three packages:
- levB.tar.bz2 (4.3 GB compressed / 8.3 GB extracted, Atrain data regridded to the SEVIRI grid)
- levC.tar.bz2 (2.0 MB compressed / 14MB extracted, the CREW SEVIRI datasets along the Atrain track)
- levS.tar.bz2 [optional] (76 GB compressed/ 139GB extracted, original CALIOP, CPR, and AMSR-E data files)
You can start downloading and unpacking levB and levC only.
Untar the files with tar -jxf filename.
(If you like to update the original satellite data and/or do another regridding, you can download levS and have a look at the folder structure.) After downloading all datasets the folder structure should look like this:
AVACS_data/levB/

AVACS_data/levC/

AVACS_data/levS/  [optional]
Installation of the AVACS software
In AVACS/version-x.y/DOCS there is a handbook for user. Follow the installation instruction in section 2 and 3.
Test new functionalities of the CREW/AVACS software
Try some CREW/AVACS examples
Updating of the level S / level B files [optional]
If there are new datasets available from CALIOP, CPR, AMSR-E or another validation dataset you may want to update the AVACS level S files and create new level B files. First you should have a look at the AVACS manual, how the files have to be stored within the AVACS levS folder. You can also download the levS.tar.bz2 files that contains the most recent version (status December 2013) of the validation data. Please have a look at the AVACS manual how to update level B files.
Updating of the level C files [optional]
In step 7 you downloaded ready-to-use level C files containing the data of the CREW SEVIRI algorithm along the ATRAIN track. If you update an SEVIRI dataset, you have to recreate the level C files.
o=obj_new('cws2')
where
atrain_overpass=11317
o->create_level_c, atrain_overpass
atrain_overpass is the integer number of the Atrain orbit number, see CREW Data Set.
Examples of SEVIRI retrieval inter-comparison (CREW software only)
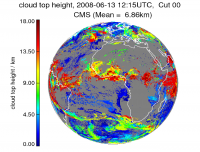
Display a cloud property of one algorithm on the MSG disk
o=obj_new('cws_stats')

o->set_product,'cth'

o->set_group,'CMS'

o->set_date,2008,6,13,12,15

o->make_image, /single

obj_destroy, o
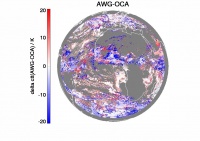
Difference of one data set to another (one picture per algorithm pair)
o=obj_new('cws_stats')

o->set_product,'ctt'

o->set_date,2008,6,13,12,00

o->diff_maps, group='AWG'

obj_destroy, o
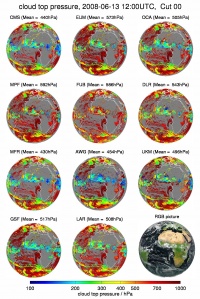
Display a cloud property of all algorithms on the MSG disk
o=obj_new('cws_stats')

o->set_product,'ctp'

o->set_date,2008,6,13,12,00

o->make_image, /no_track

obj_destroy, o
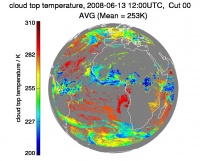
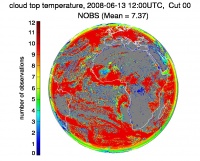
Calculate multi algorithm ensemble average
Note, first you have to calculate the multi ensemble average with o->algorithm_average(/calc, /save, mask='com'). As the default resolution is a reduced resolution, you have to specify explecitely the scale=1, when you create the cws_stats object. If the average file is created, you can handle the average like a group by setting the group to 'AVG' and make plots like in the other examples (and of cause you can use the default reduced resolution again). By setting the group to 'NOBS' you can make plots of the number of algorithm observation.
o=obj_new('cws_stats', scale=1)

o->set_product,'ctt'

o->set_date,2008,6,13,12,00

avg = o->algorithm_average(/calc, /save, mask='com')

o->set_group,'AVG'

o->make_image, /single

o->set_group,'NOBS'

o->make_image, /single

obj_destroy, o
Calculate multi algorithm ensemble standard deviation
Note, first you have to calculate (and save) the multi algorithm ensemble average like in the example before. Then you have to calculate the multi algorithm ensemble standard deviation. Like in the example before, you have to specify explecitely the scale=1, when you create the cws_stats object. If the standard deviation file is created, you can handle the absolute and relative standard deviations like a group by setting the group to 'STD_ABS' and 'STD_REL' respectively, and make plots like in the other examples (and of cause you can use the default reduced resolution again).
o=obj_new('cws_stats', scale=1)

o->set_product,'ctt'

o->set_date,2008,6,13,12,00

std_abs = o->algorithm_stddev (/calc, /save, mask='com')

o->set_group,'STD_ABS'

o->make_image, /single, min=0, max=20

std_rel = o->algorithm_stddev (/calc, /save, mask='com', /relative)

o->set_group,'STD_REL'

o->make_image, /single

obj_destroy, o


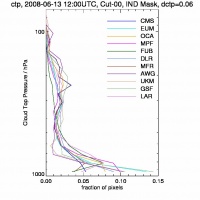
1d histogram
o=obj_new('cws_stats')

o->set_product,'ctp'

o->set_date,2008,6,13,12,00

o->hist1d

obj_destroy, o
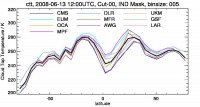
dependency on latitude
o=obj_new('cws_stats')

o->set_product,'cth'

o->set_date,2008,6,13,12,00

o->dep

obj_destroy, o
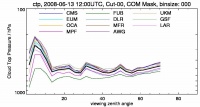
dependency on viewing zenith angle
o=obj_new('cws_stats')

o->set_product,'ctp'

o->set_date,2008,6,13,12,00

o->dep, /vza

obj_destroy, o
Simple statistics as a table
o=obj_new('cws_stats')

o->set_product,'ctp'

o->set_date,2008,6,13,12,00

o->make_tables

obj_destroy, o

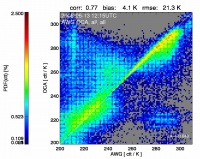
Two algorithm scatter plot
o=obj_new('cws_stats')

o->set_product,'ctt'

o->set_date,2008,6,13,12,00

o->make_corSingle

obj_destroy, o
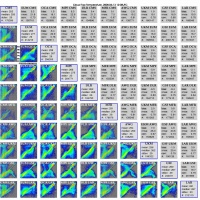
Thumbnails of all scatter plots
o=obj_new('cws_stats')

o->set_product,'ctt'

o->set_date,2008,6,13,12,00

o->make_corThumb

obj_destroy, o
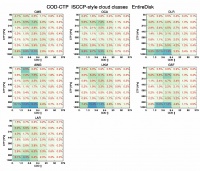
Make ISCCP like plots
o=obj_new('cws_stats')

o->cod_ctp

obj_destroy, o
