More advanced example
From CrewWiki
| Line 11: | Line 11: | ||
</code><br> | </code><br> | ||
[[File:single_image.png|200px|CMS cloud top height]]<br> | [[File:single_image.png|200px|CMS cloud top height]]<br> | ||
| + | <br> | ||
| + | |||
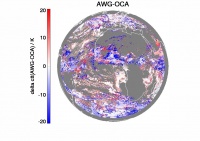
| + | ==Difference of one data set to another (one picture per algorithm pair)== | ||
| + | <code> | ||
| + | o=obj_new('cws_stats') <br> | ||
| + | o->set_product,'ctt'<br> | ||
| + | o->set_date,2008,6,13,12,00<br> | ||
| + | o->diff_maps, group='AWG'<br> | ||
| + | obj_destroy, o<br> | ||
| + | </code><br> | ||
| + | [[File:ctp_difference.jpg|200px|cloud top temperature difference]] | ||
<br> | <br> | ||
| Line 90: | Line 101: | ||
<br> | <br> | ||
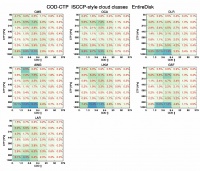
| - | == | + | ==Make ISCCP like plots== |
<code> | <code> | ||
o=obj_new('cws_stats') <br> | o=obj_new('cws_stats') <br> | ||
| - | o-> | + | o->cod_ctp<br> |
| - | + | ||
| - | + | ||
obj_destroy, o<br> | obj_destroy, o<br> | ||
</code><br> | </code><br> | ||
| - | [[File: | + | [[File:isccp.jpg|200px|ISCCP like CTP COD histogram]] |
<br> | <br> | ||
Revision as of 18:22, 18 February 2014
Go back to CREW software package
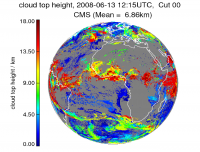
Display a cloud property of one algorithm on the MSG disk
o=obj_new('cws_stats')

o->set_product,'cth'

o->set_group,'CMS'

o->set_date,2008,6,13,12,15

o->make_image, /single

obj_destroy, o
Difference of one data set to another (one picture per algorithm pair)
o=obj_new('cws_stats')

o->set_product,'ctt'

o->set_date,2008,6,13,12,00

o->diff_maps, group='AWG'

obj_destroy, o
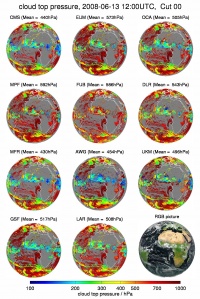
Display a cloud property of all algorithms on the MSG disk
o=obj_new('cws_stats')

o->set_product,'ctp'

o->set_date,2008,6,13,12,00

o->make_image, /no_track

obj_destroy, o
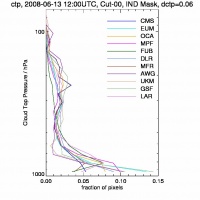
1d histogram
o=obj_new('cws_stats')

o->set_product,'ctp'

o->set_date,2008,6,13,12,00

o->hist1d

obj_destroy, o
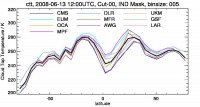
dependency on latitude
o=obj_new('cws_stats')

o->set_product,'cth'

o->set_date,2008,6,13,12,00

o->dep

obj_destroy, o
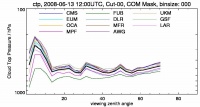
dependency on viewing zenith angle
o=obj_new('cws_stats')

o->set_product,'ctp'

o->set_date,2008,6,13,12,00

o->dep, /vza

obj_destroy, o
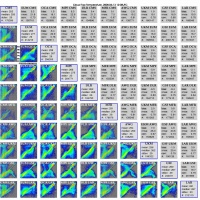
Simple statistics as a table
o=obj_new('cws_stats')

o->set_product,'ctp'

o->set_date,2008,6,13,12,00

o->make_tables

obj_destroy, o

Two algorithm scatter plot
o=obj_new('cws_stats')

o->set_product,'ctt'

o->set_date,2008,6,13,12,00

o->make_corSingle

obj_destroy, o
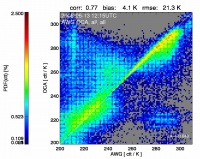
Thumbnails of all scatter plots
o=obj_new('cws_stats')

o->set_product,'ctt'

o->set_date,2008,6,13,12,00

o->make_corThumb

obj_destroy, o
