Anapol: Visualization and Analysis of POLDER and PARASOL data through a graphical interface
Language/Format: IDL
Application type(s): Analysis, Visualization
Related project(s): PARASOL, POLDER
Description
Anapol is an IDL graphic interface for POLDER and PARASOL data visualization and analysis.
The functionalities of the program are :
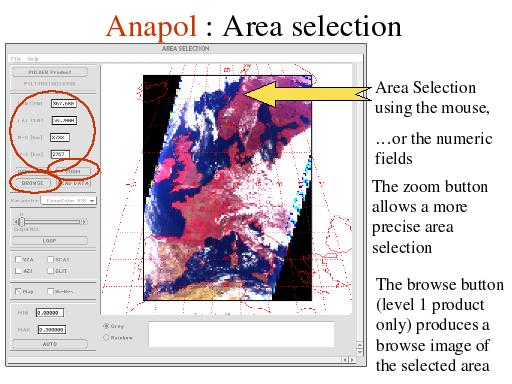
- Selection of the region of interest from coordinates or using the mouse over a browse image
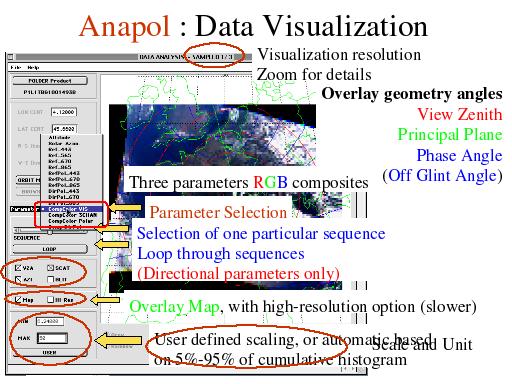
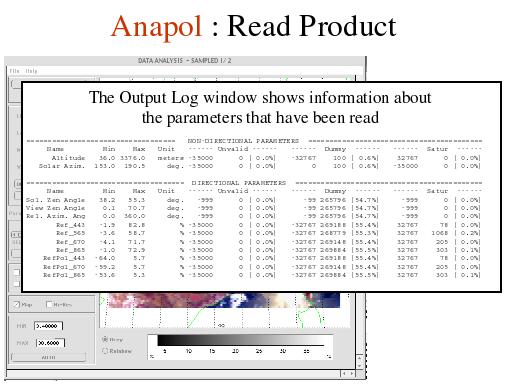
- Visualization of non-directional and “directional” parameters
- Multi-parameter false color composites
- Automatic or user-based min-max range.
- Animation of successive POLDER sequences (for directional parameters)
- Overlap of viewing geometry angles (for directional parameters)
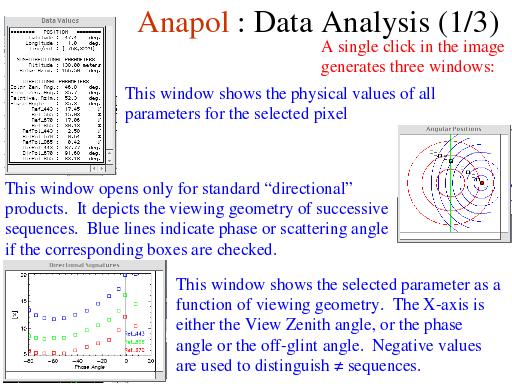
- Extraction of individual pixel values
- Plots of parameter histograms
- Plots of parameter directional signatures, with several options for the angle of interest.
- Image saving in Jpeg format
- Data saving in HDF-EOS format
For a complete description of Anapol capabilities, see the anapol file in the package.
Download
You can use Anapol either with or without an IDL licence.
with a license
Download the whole package :
without a license
In this case, you should download the free IDL Virtual machine.
When you run the Virtual machine, select the following compiled module :
Examples
Some outlines examples :

