CREW/AVACS examples
From CrewWiki
(→CTH histogram along the ATRAIN track) |
|||
| Line 14: | Line 14: | ||
<code> | <code> | ||
o=obj_new('cws_stats') <br> | o=obj_new('cws_stats') <br> | ||
| - | o->atrain_hist, overpass=[11317,11318,11319]<br> | + | o->atrain_hist, overpass=[11317,11318,11319], show_group='ALL', mask='IND'<br> |
| + | o->atrain_hist, overpass=[11317,11318,11319], show_group='ALL', mask='COM', xrange=[0,0.05]<br> | ||
obj_destroy, o<br> | obj_destroy, o<br> | ||
</code><br> | </code><br> | ||
| - | [[File: | + | [[File:atrain_histogram_ind.jpg|200px|CTH histogram Atrain individual mask]] |
| + | [[File:atrain_histogram_com.jpg|200px|CTH histogram Atrain common mask]]<br> | ||
==Scatterplots SEVIRI against CALIOP or CPR== | ==Scatterplots SEVIRI against CALIOP or CPR== | ||
Revision as of 11:11, 25 February 2014
Go back to CREW software package
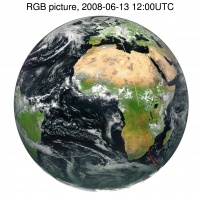
Display a RGB image with the track of the ATRAIN satellite constellation
o=obj_new('cws_stats')

o->set_product,'rgb'

o->set_date,2008,6,13,12,00

o->make_image, /single, /track

obj_destroy, o
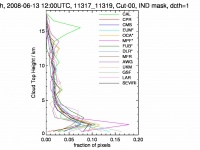
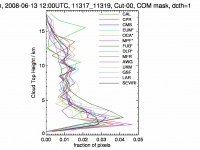
CTH histogram along the ATRAIN track
o=obj_new('cws_stats')

o->atrain_hist, overpass=[11317,11318,11319], show_group='ALL', mask='IND'

o->atrain_hist, overpass=[11317,11318,11319], show_group='ALL', mask='COM', xrange=[0,0.05]

obj_destroy, o
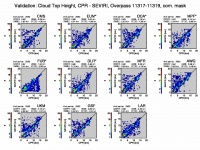
Scatterplots SEVIRI against CALIOP or CPR
o=obj_new('cws_stats')

o->set_product,'cth'

o->calipso_cpr, sensor='CPR', overpass=[11317,11318,11319]

obj_destroy, o
CTH cross-section along ATRAIN track: SEVIRI, CALIOP and CPR
o=obj_new('cws_stats')

o->set_date,2008,6,13,13,45

o->cth_all, cut=16

obj_destroy, o

COD cross-section along ATRAIN track: SEVIRI, CALIOP and CPR
o=obj_new('cws_stats')

o->set_date,2008,6,13,13,45

o->cod_all, cut=16

obj_destroy, o

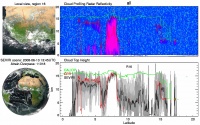
Cross-section along ATRAIN track with RGB image
o=obj_new('cws_stats')

o->set_date,2008,6,13,13,45

o->brian_profile, cut=16

obj_destroy, o
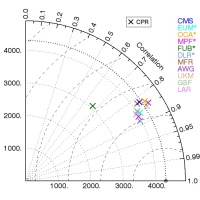
Taylor plots
o=obj_new('cws_stats', scale=1)
o->taylor, overpass=[11317,11318,11319], atrainsensor='CPR'
obj_destroy, o
