Display 2D data with Python
Description
This page gives an example for creating an image from a 2D data array with Python and the Matplotlib library. In this particular case, the data are read from an HDF4 file, but it can also be read from any source as long as the data are passed to Matplotlib in a numpy array.Prerequisites
Language- Python
- pyhdf
- matplotlib
- numpy

Input File
The data file used in the example below is : Cardinal_sine_2D.hdf
Output Image
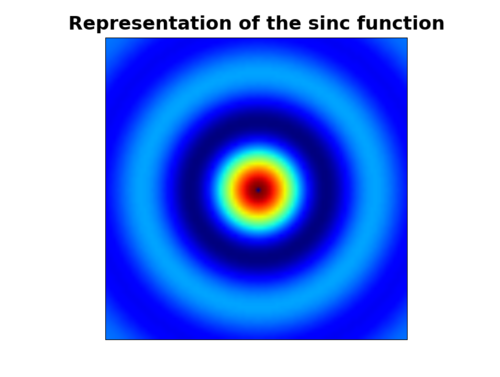
The program creates the image Representation (2D) of the sinc function
Source Code
from pylab import *
from numpy import *
from pyhdf.SD import *

# Path to the file
fileName = "Cardinal_sine_2D.hdf"

# Open HDF file for reading
filehdf = SD ( fileName )

# Reading attributes
print "file : ", fileName

# Read the sds data
sds = filehdf.select ( 0 ).get ( )

# Display image
imshow ( sds )

# Image title
title ( "Representation of the sinc function", weight = "bold", size = 22 )

xticks([])
yticks([])

# Save the current figure
savefig ( "Cardinal_sine_2D.png" )
show()

# Terminate access to the file
filehdf.end()


